June 17, 2026, marks my 1,000th “Today’s Advice.” About 20% tackle topics others evade; I distill common subjects from previous advisors, filtered and seasoned to my taste. If you know someone who is hooked on horoscopes, nudge them here for more useful issues and attitudes, with zero embarrassing pseudoscience.
New page! Free planks for candidates.
Cataract surgery successful.
- — < ◊ > — -
—> Formatted for desktop screens; server scrambles segments for mobile devices. <—
Smarts and smiles! This website rewards time and thought with original ideas and products. Everything here is by and for real humans. Not for “tl;dr” simpletons; suckers seeking instant oversimplifications should retreat back to the rest of the Internet. No artificial intelligence hallucinations, no “enshittification”, no loyalty bribe, no app.
Email: normsperling@gmail.com Postal: 2625 Alcatraz Avenue #235, Berkeley, California 94705 USA.
- — < ◊ > — -
NEW CHART UNIFIES STARS AND SOLAR SYSTEM
All Cosmic Bodies™,
From Meteorites to Stars,
Are Actually Cousins
© 2026 Norman Sperling
For the first time, you can understand the Solar System as a family of cousins, not a sideshow of freaks.
Space Age research reveals that stars, planets, moons, asteroids, comets, and meteorites each clumped from a cold nebula 4.56 billion years ago … heated … stirred … and banged around. The nebula was loaded with hydrogen, helium, water, carbon dioxide, methane, ammonia, tar, silicates, iron, and nickel. How much mass, and how hot they got, determined each clump’s peak core temperature and what processes it went through, its inside and surface structure, and how it looks now. Mass + Heat → Destiny.
Pictured: Paper Pasteup Placeholder. Artwork in progress.
Novel breakthrough! Graphing mass versus temperature reveals sensible relationships and categories, which I color-code. I converted mass measurements from “Earths” and “Suns” to kilograms. I sought best estimates of core temperature, since that’s not yet measured directly.
From most massive to least:
Red: stars condense onto the “Main Sequence”, types MKGFABO, fusing hydrogen into helium-plus-energy. Later, massive stars’ cores heat up even more, evolving relentlessly rightward. Stars running low on fuel bloat into red giants. They die as white dwarfs, or go supernova. Those make neutron stars, or disappear into black holes.
Yellow [brown in the paper pasteup placeholder]: Brown dwarf and gas giant substars have the same gases as stars, but too little to exert enough gravity to compress the core enough to fuse hydrogen. Legacy labels mislead: brown “dwarfs” have much more mass than gas “giants”.
Green: crusted spheres pull themselves round because their gravity is stronger than molecular forces. Wherever stuff flows, gravity forces spherical layering. Much rock and metal melts about 1100ºC (the black vertical line). Light stuff floats: atmospheres above oceans above crusts. Dense stuff sinks into cores and layers between. Watch layering in Italian salad dressing and anything you “shake before using”.
Orange: Over the eons, collisions shattered and scattered fragments far and wide. Millions orbiting the Sun are called “asteroids”; hundreds orbiting planets are called small moons; thousands hitting Earth are called “meteorites”. They hold uneven shapes because molecular forces are stronger than small bodies’ gravity.
“Rubble Piles” cling together weakly. Heating and compressing make materials stronger. Notice the slope from brittle, weak always-cool bodies to compressed bodies, to molten, layered, and refrozen bodies. That lets bigger pieces survive impact. The top of the meteorite purple zone slopes up from C to H to iron; the top of the asteroid orange zone slopes up from C to B to G; the top of the crusted sphere green zone slopes up from Callisto to Mars to Earth. Humans also use heat and pressure to strengthen materials for engineering, charted by Michael F. Ashby.
Purple: Rock and metal shards land on Earth as meteorites, which experienced processes and substances throughout the solar system. Some come from the Moon, Mars, and asteroid 4 Vesta. Probably 6 Hebe ➔ H meteorites; 8 Flora ➔ L; 44 Nysa ➔ E; and 50 bodies that melted, layered, refroze, and smashed ➔ irons.
Blue: comets have surface ices, no matter what’s beneath. Original cores are patchworks of ices, tars, and porous rock. Ices evaporate, so the C1 pieces we find on Earth are tars and porous rock.
The legacy-term “planets” overlaps the largest crusted spheres and the smallest substars. The old term “substars” and the new term “crusted spheres” are lower-case, unofficial, and purely descriptive. If officials make those labels official, they can capitalize them.
BODIES: A Body is a single, tightly bound, contiguous entity. An astronomical “object” may consist of multiple “bodies”. This graph of bodies’ masses versus core temperatures does not include astronomical “objects” which are not “bodies”:
Nebulas, because they are not tightly bound, and photos reaching ever fainter find ever more parts.
Clusters, which contain many bodies like stars and colder spheres.
Galaxies, which contain a great many such bodies.
Also, Singularities, the massive cores of black holes, because their core temperatures can’t be determined.
No explorer or device has reached the center of any celestial body, so core temperatures derive from how matter and energy behave. Peak temperature determines a body’s layering, its reactions, and its solids’ strength.
This colorful graph will come in 2 versions, great for the science-literate public, especially astronomers, educators, hobbyists, past and present astronomy students, planetaria, model solar systems, and more.
The Free Single-Page version will be a downloadable .pdf, 978-0913399-41-5. We invite and permit people who do, teach, study, communicate, or facilitate Science to copy this version for free, if credited to “© 2026 Norman Sperling, EverythingInTheUniverse.com. All rights reserved.” You’re welcome to download the placeholder here if you can’t wait for the improved graphics. All other users and uses: request from normsperling@gmail.com.
And a glorious 24 x 36-inch poster, almost 10 times bigger, with thrilling photos of the bodies in space, and telling richer explanations and background. Buy the enriched poster version soon. 978-0913399-42-2. BISAC SCI 004000 astronomy. Product code BODS.
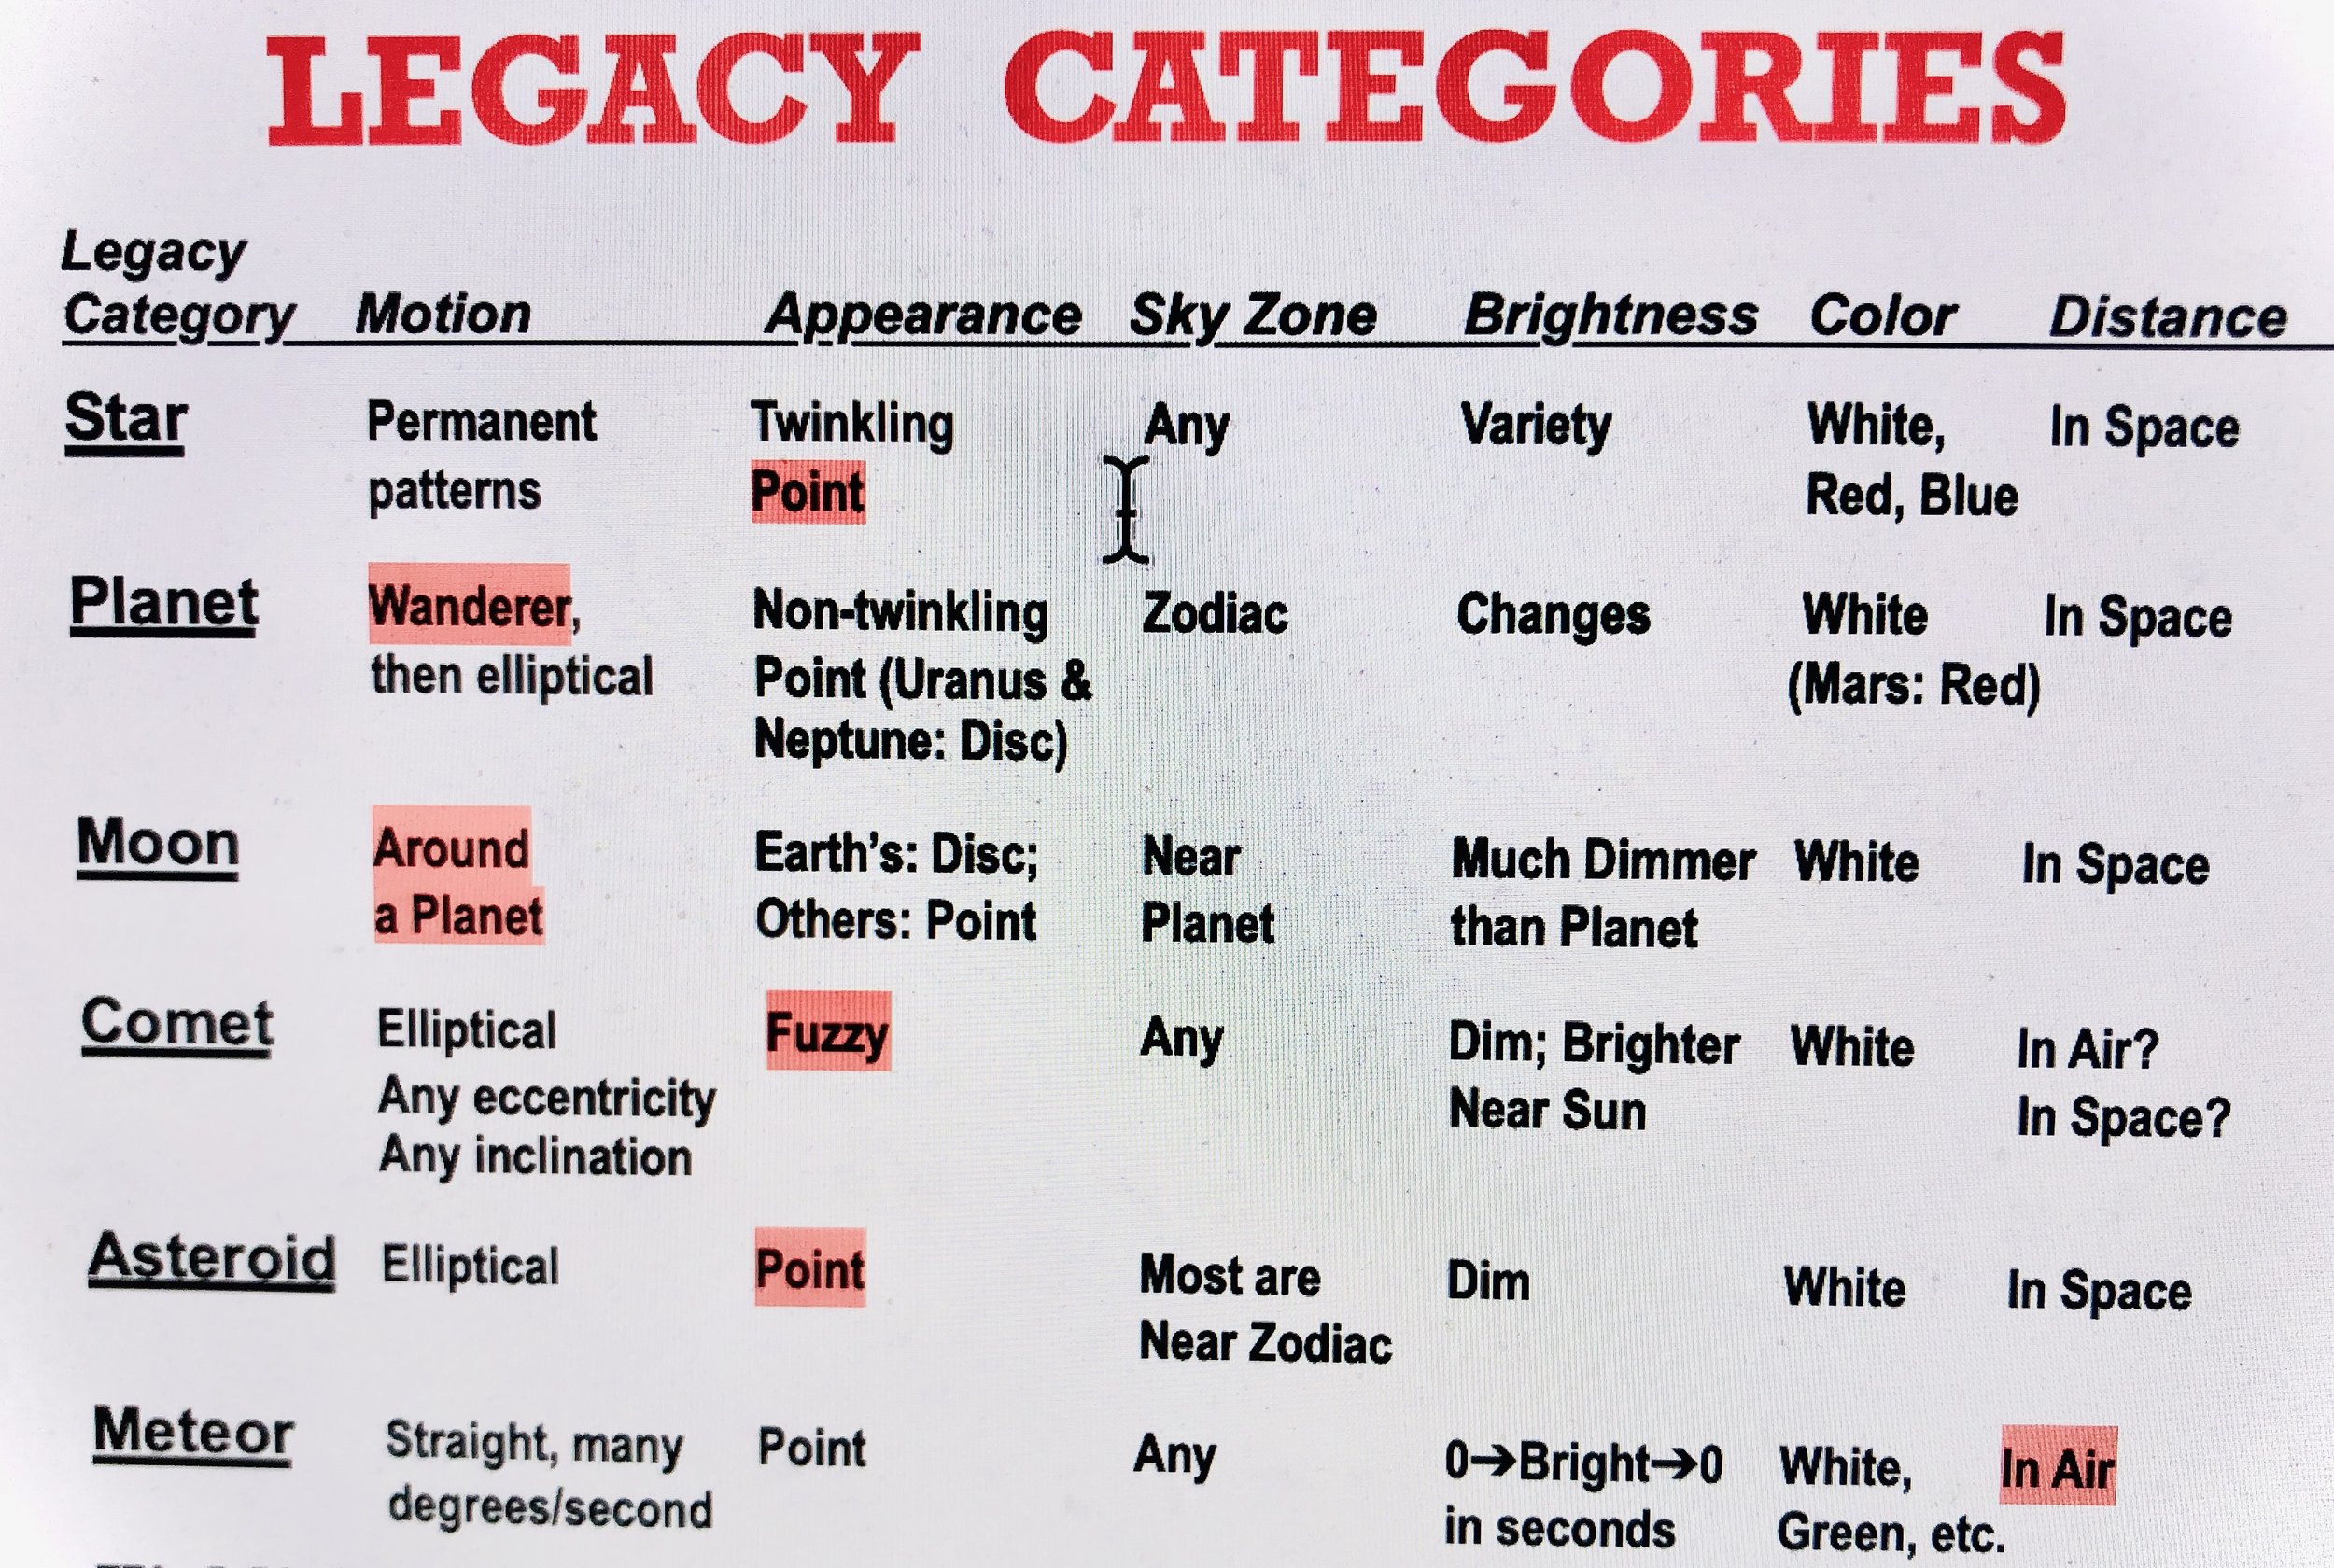
Legacy Categories
Astronomers, groping in the dark for thousands of years, categorized Stars, Planets, Moons, Comets, Meteors, and Asteroids. Each was distinguished by just one single characteristic, out of many apparent by the 1600s (asteroids: 1800s). Legacy categories set up a sideshow of freaks.
“Planets” go around the Sun. “Moons” go around planets. Those only deal with motions, not components or processes — or sizes, since the moons Ganymede and Titan are wider than the planet Mercury.
“Comet” meant “fuzzy” and “Asteroid” meant “star-like”: appearance, not motion or components or processes.
“Meteor” meant “in the air”, with no hint about what it’s made of.
Compare factors:
The boundary between Asteroids and Meteoroids is whether we can see them before we collide. The smallest asteroid or moon found with the telescopes of
1804 was 250 km wide (3 Juno);
1877: 12.5 km (Deimos);
1891: 6.5 km (315 Constantia);
1932: 857 m (1221 Amor).
Millions of bodies have moved from the Legacy category of [unseen] “Meteoroids” to [seen] “Asteroids” not because the bodies changed at all, but because telescopes improved. Categorizing bodies by which telescopes we view them through is poor Science.
Why is This Better Than Antiquated Legacy Categories?
1-PAGE POSTER
✅ Free
✅ ✅ Plots all bodies on the same scales
✅ ✅ Unifies everything to the Metric System
✅ ✅ Mass and temperature mark off categories
✅ ✅ Color coded classes: stars are red, ices are blue
✅ ✅ Doesn’t force gases and solids into the same category
✅ ✅ Plain-English concepts evade technical terms
✅ ✅ Shows that layering by density is a major process
✅ ✅ Clarifies most meteorites as fragments of asteroids
✅ Glorious images of heavenly bodies
✅ Exposes Legacy categories’ flimsy standards
✅ Enriched explanations (also on this webpage)
✅ Shows that heat and pressure strengthen solids
✅ Nature’s narrow criteria for volcanoes and tectonics
✅ Chart: where elements come from
What About the Hertzsprung-Russell Diagram?
In 1911 and 1913, those important astronomers graphed stars’ surface temperatures versus inherent brightnesses. After more than a century, it is still the most important graph in astronomy. The H-R Diagram only plots stars, but has no place for planets, asteroids, comets, or their pieces. Not merely updating H-R, but recasting major issues, on this new “All Cosmic Bodies” graph:
✅ ✅ Stars relate to planets, comets, asteroids
✅ ✅ Temperature increases to the right, not the left
✅ ✅ Core temperature is more important than surface’s
✅ ✅ Mass is much more fundamental than brightness
✅ ✅ Undistracted by “magnitude’s” backward 5th-root-of-100 ratio
✅ ✅ Stars evolve straight right, not scampering helter-skelter
points to ✅ Where neutron stars fit